Atmospheric CO2 is higher today than yesterday. Check here
Today, we will release1 million tons of carbon dioxide per hour into the Earth's atmosphere.
Increasing Carbon Dioxide (CO2)
Up to the pre-industrial period, the concentration of CO2 was 280 ppm. Today, it has broken an 800,000 year upper threshold, check the graphs below. Currently, about
half of the carbon dioxide released through human activities remains in the atmosphere and is not absorbed by vegetation and the oceans.
According to a 2019 study, we are releasing around 1 million tons of carbon dioxide per hour into the Earth's atmosphere. About 25% of this gas is taken up by the ocean where it reacts with seawater to form a weak acid, causing surface ocean pH to fall by around 0.002 units per year.
Just two countries, China and the US, are responsible for more than 40% of the world’s CO2 emissions. Check the other countries responsible for more than two thirds of the world's CO2 emissions.
An analysis published in June 2019 finds that climate change could end human civilisation as we know it by 2050. Pieter Tans, an atmospheric scientist with NOAA's Global Monitoring Division said "Many proposals have been made to mitigate
global warming, but without a rapid decrease of CO2 emissions from fossil fuels they are pretty much futile". Also, bearing in mind that the human population is continuing to grow at around 82 million people per year. See population growth graph below.
Defining the 'pre-industrial' Period
At the moment, researchers tend to use the period 1850-1900, and this will often be described as "pre-industrial". But the reality is that this date range came after industry really got going. Curiously, the pre-industrial era is not defined by the UN agreements, or by the Intergovernmental Panel on Climate Change. A period of 1720 - 1800 has been suggested as a preferred choice. See the
Climate Lab Book for insights.
Major Sources of atmospheric CO2
The two major sources of atmospheric CO2 are fossil fuel emissions and deforestation. Fossil fuels like coal and oil were once plants that absorbed CO2 from the atmosphere through photosynthesis over many millions of years. Each time we burn fossil fuels, its stored carbon is released back into the atmosphere.
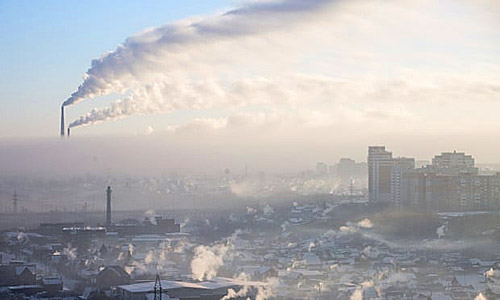
Image credit: Dmitry Feoktistov
The amount of CO2 in the atmosphere is higher today than any time in the past 800,000 years. The last time CO2 amounts were this high was more than 3 million years ago, when temperatures were 2°–3°C (3.6°–5.4°F) higher than during the pre-industrial era, and sea levels were 15–25 meters (50–80 feet) higher than today.
Green plant life, on land and in the oceans, are major carbon sinks, absorbing CO2 in sunlight to synthesise food energy. But burning forests not only creates more CO2, it destroys the plants that helps absorb it. The burning process also consumes the oxygen that we breathe and the trees no longer exist to continue producing oxygen.
Warmed by sunlight, Earth’s land and ocean surfaces continuously radiate heat. Carbon dioxide absorbs that heat and releases it gradually over time. Today, the amount of carbon dioxide accumulated, and heat to be released, is beyond that which Earth can naturally process. Consequently, additional heat is trapped raising Earth's average temperature, hence the term greenhouse gas. Methane and
nitrous oxide are also greenhouse gases.
Excess CO2 emitted by man since the pre-industrial era is predicted to remain in the atmosphere for centuries to millennia, even after emissions stop. Moreover, if human carbon dioxide emissions were to completely cease, atmospheric temperatures are not expected to decrease significantly for at least 1,000 years.
In its annual bulletin on greenhouse gas levels, the World Meteorological Organisation (WMO) said there is no sign of a reversal in the trend in increasing emissions which are driving climate change, sea level rises,
extreme weather and making oceans more acidic. The WMO secretary general, Petteri Taalas said: “Without rapid cuts in carbon dioxide and other greenhouse gases, climate change will have increasingly destructive and irreversible impacts on life on Earth. The window of opportunity for action is almost closed.”
Increasing World Population and Corresponding Increase in CO2
The increase in atmospheric CO2 is directly related to the increase in world population, as can be seen from the two graphs below, The graph below shows the rapid increase in human population over a very short period of time. We now stand at around 7.7 billion people as of June 2019 the world population
is continuing to grow at an estimated 82 million people per year.
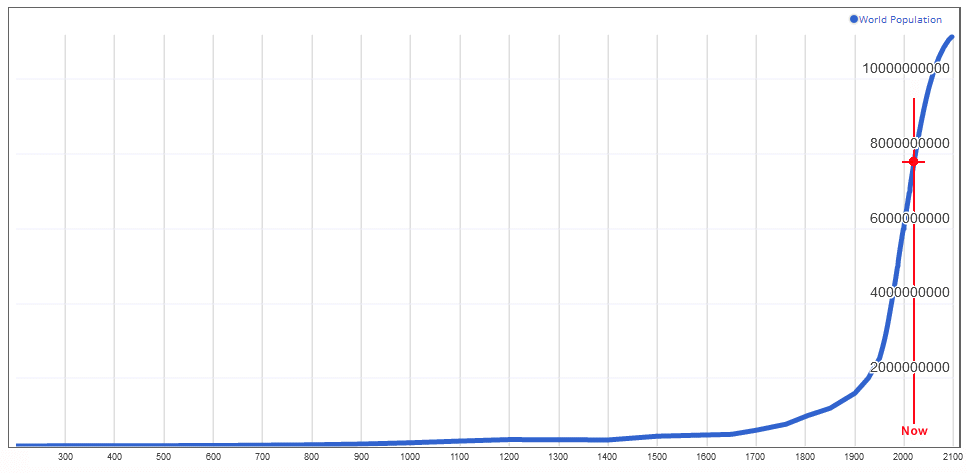
World Population: Past, Present and Future
Global CO2 Levels
The rise in world population above, can be compared with the rise in global carbon dioxide in the interactive graph below. Alarmingly, like the increase in global population, the level of CO2 today is greater than it was yesterday. You can check for yourself - mouse over the graph to compare today's level of CO2 with previous days, or years, or centuries.
Using the top right menu button in this graph, you can also see the corresponding increase in the greenhouse gases Methane (CH4) and Nitrous Oxide (N2O). To re-set the graphs, refresh the page.
Atmospheric Carbon Dioxide Levels Graph
This graph features atmospheric CO2 levels that combine measurements from as far back as 800,000 years up to the present day.
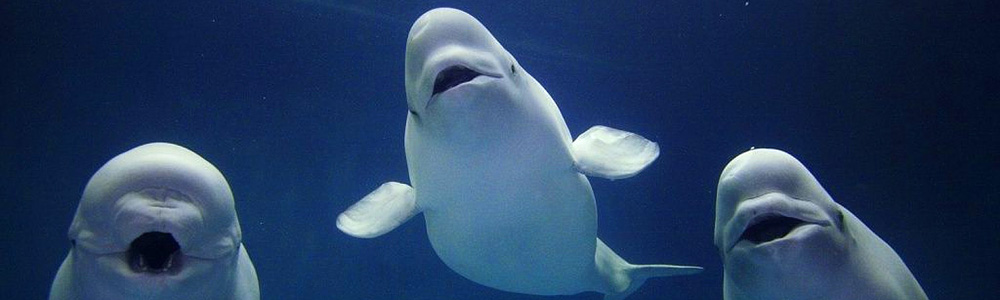
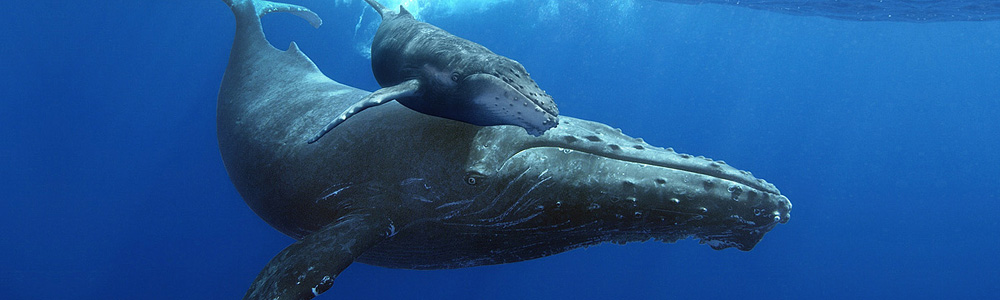
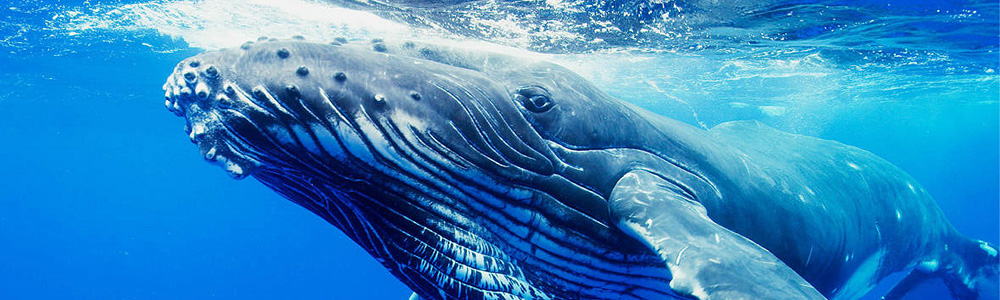
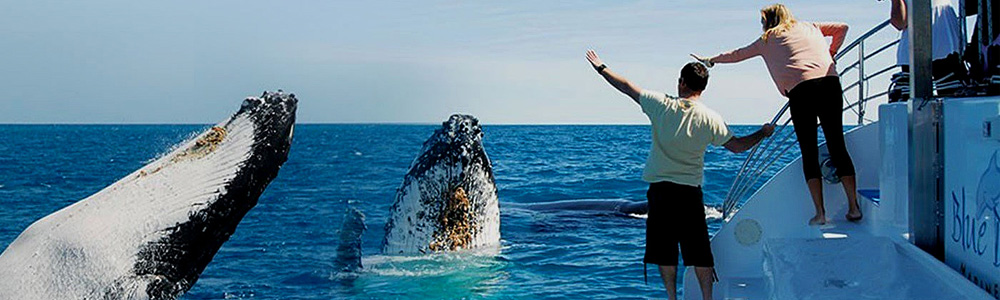
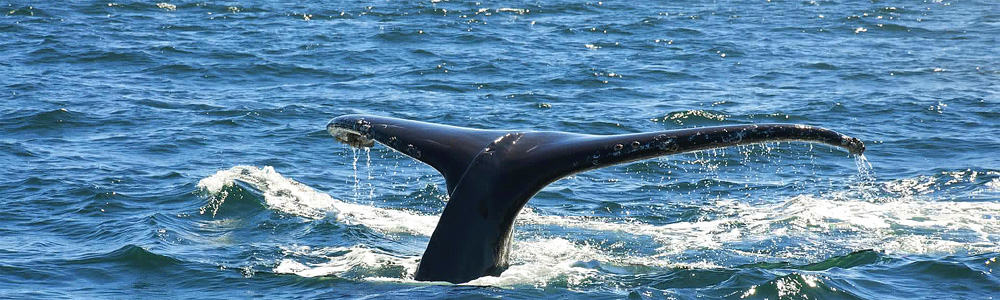
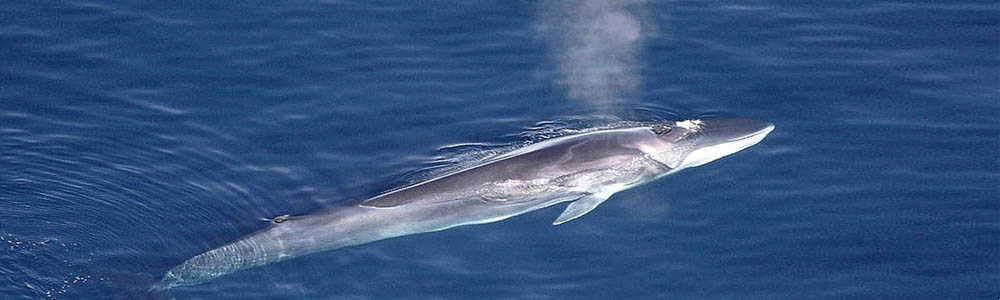
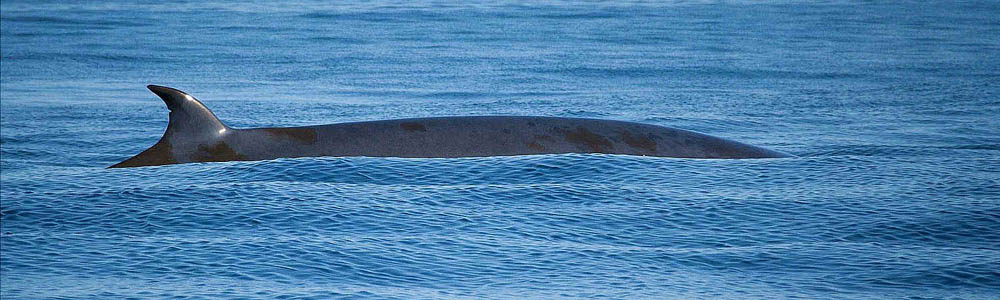
Future recovery of baleen whales is imperiled by climate change
The results of 2019 study show that historic commercial whaling and future climate change predicts concerning declines in baleen whale populations. (blue, fin, humpback, Antarctic minke, southern right) and their prey (krill and copepods)
The study highlights the need for ongoing protection to help depleted whale populations recover, as well as local management to ensure the krill prey base remains viable, but this may have limited success without immediate action to reduce carbon emissions.
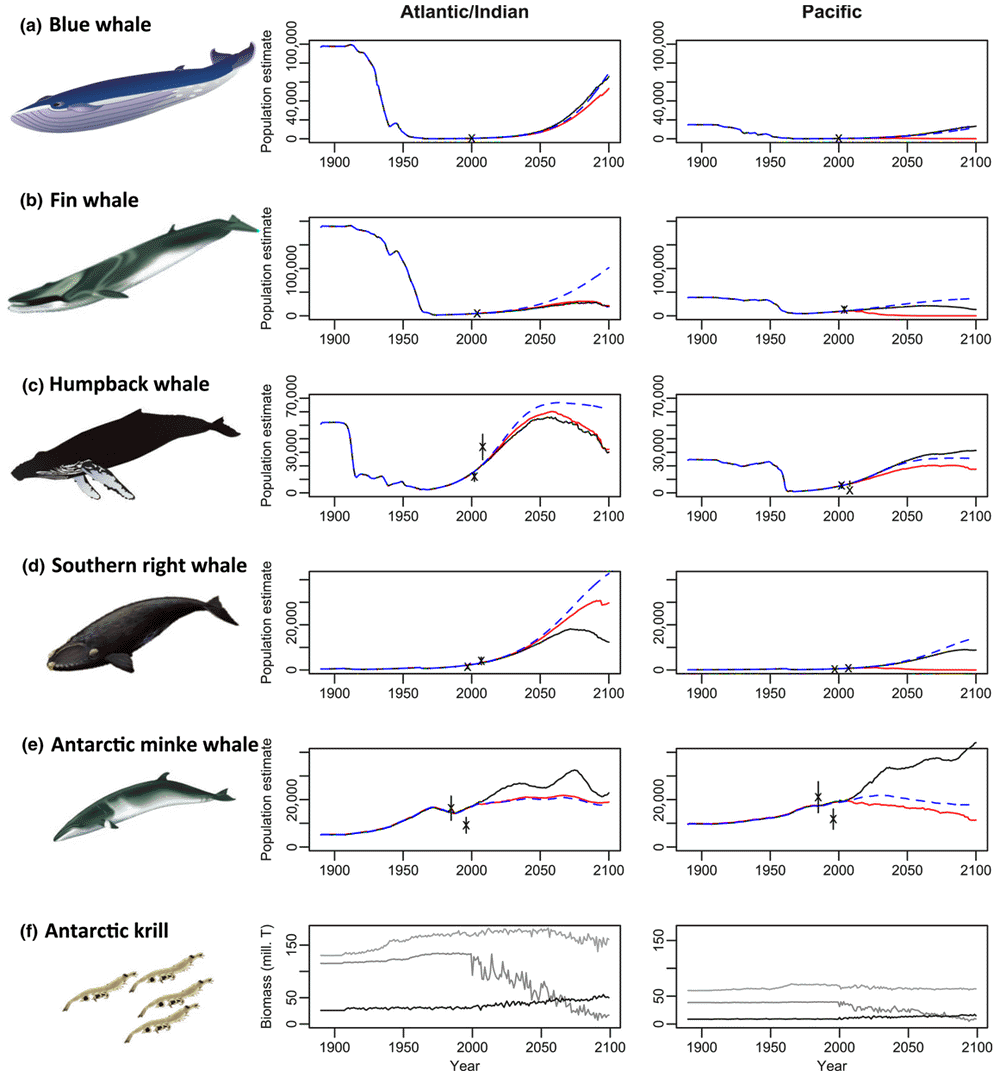
Image credit: Future recovery of baleen whales is imperiled by climate change, published 26 February 2019
Whale and krill population trajectories based on historic commercial whaling and future climate change
The model‐estimated whale population trajectories above are shown for female population of (a) blue, (b) fin, (c) humpback, (d) southern right and (e) Antarctic minke whales in the Southern Hemisphere and (f) krill biomass predictions, for the Indian/Atlantic area (left) and the Pacific area (right).
For whale population estimated (a–e), trajectories are shown for the preferred Model 1 linked to climate drivers (red line), Model 2 that includes sea‐ice links to whale distribution (black line) and the comparison with Model 3 that excludes climate drivers (blue dashed line).
For whale trajectories (a–e), cross symbols show survey abundance observations and associated standard errors for the respective regions to which the model was fitted.
Circumpolar estimates and fits are shown in the Supplementary (Figure S4). For krill biomass (f), we show predictions for latitudes 50–60°S (light grey), 60–70°S (grey) and 70–80°S, (black), for climate‐driven Models 1 and 2. There were no krill
in latitudes 40–50°S. Note vertical axes have different scales.